
I’m a fan of testing in production, especially when it comes to complex systems with a wide range of user behaviour. You can only go so far with synthetic experiments before you need to try something out for real, but as with anything in production, it’s not without risk.
Several years back I was at GoCardless, migrating our infrastructure from IBM Softlayer to Google Cloud Platform. As a payments platform, GoCardless needed to offer a reliable service: if we screwed up this migration, we’d drop requests and prevent our merchant’s customers from completing checkout flows.
Keen to avoid this, we wanted to split the migration into milestones that could answer specific concerns we had about the move, gradually increasing our confidence until we felt comfortable moving even the most critical of our systems.
Thankfully, GoCardless’ architecture was simple back then: we had a single Rails app sat on top of a Postgres database, providing an HTTP API and running several async workers.
The plan of attack would be:
- Move async workers into GCP, connecting to database in Softlayer
- Move API into GCP, connecting to database in Softlayer
- Move database into GCP
Each one of these steps was risky, and could cause a customer facing problem.
As an example, we were moving the app into GKE, away from our home-grown container management system in Softlayer: had we configured envvars correctly? Would the networking perform the same? Might our resource limits be wrong?
That and several other binary it-works-or-it-doesn’t risks would be obvious from the moment we try running work in GCP. Identifying these errors is why you move the async workers first: they aren’t in a critical user path, will be retried, and we could provide a fix before the next retry.
Those are the boring risks though, and this post is about a much nastier risk than misconfiguration. The thing we were most concerned about, and what we needed to really think about and test, was…
Performance.
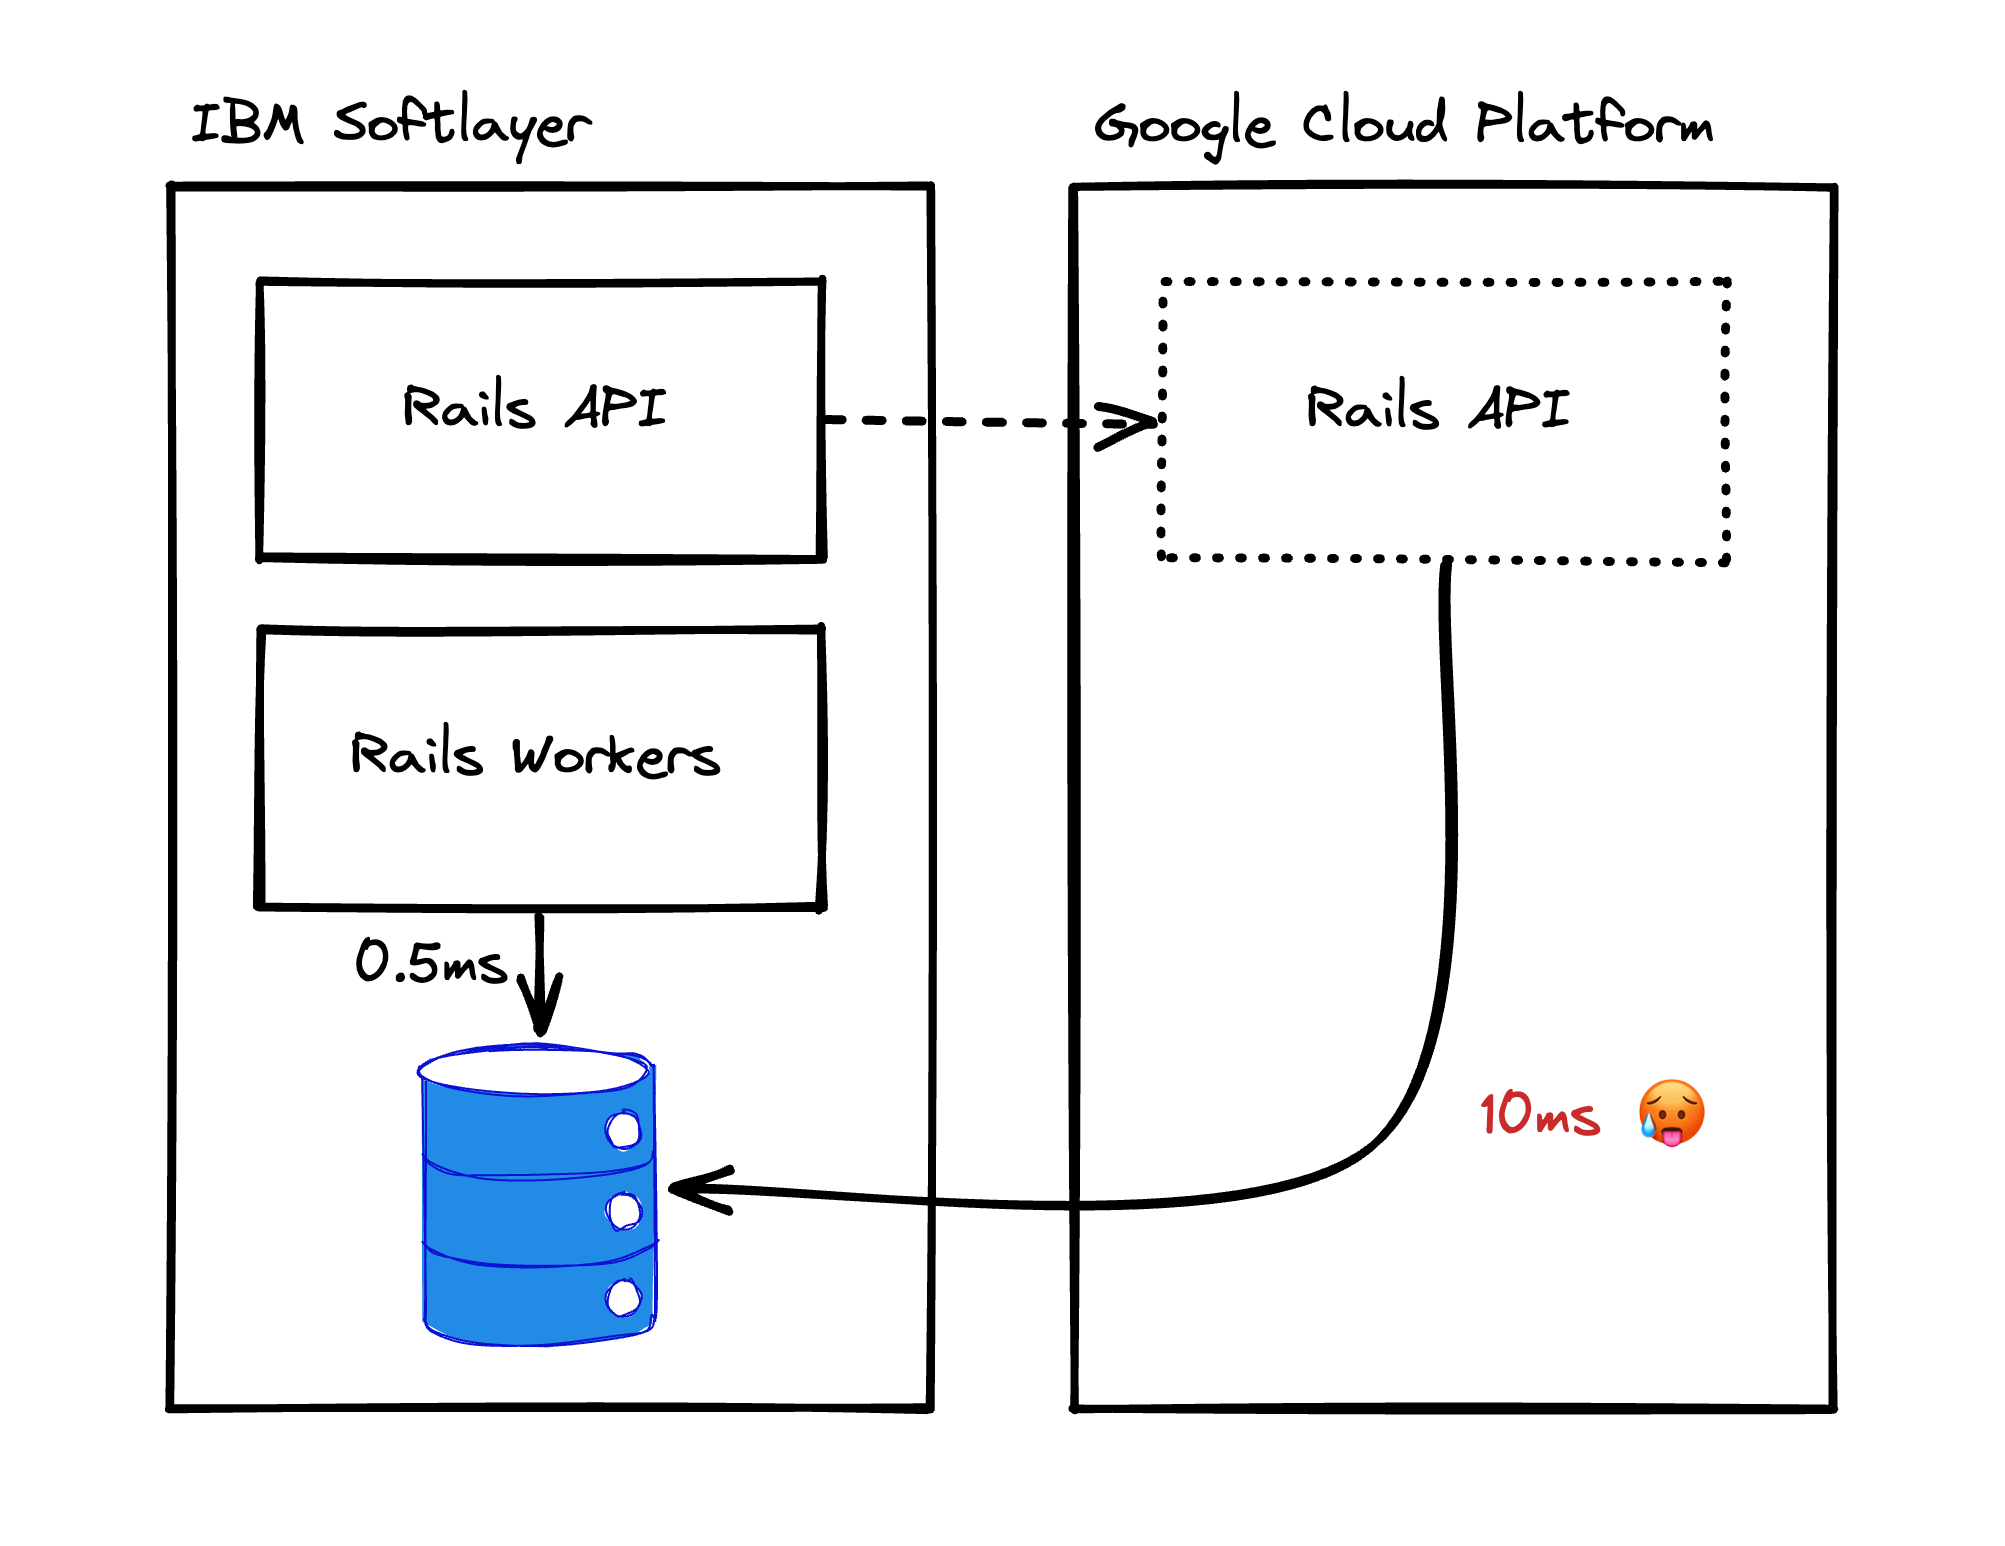
Notice that the plan explicitly mentions our async workers and API will be moved to GCP, but continue to connect to the Postgres database inside of Softlayer.
That’s because adding the network hop via the IPSEC tunnel and over the public internet is expensive, meaning all communication would suffer from a constant latency penalty. It was going to change the cost of communicating with the database from 0.5ms in Softlayer to about 10ms when coming from GCP.
Rails apps are encouraged to assume latency to the database is essentially ‘free’, and ActiveRecord is an especially chatty ORM. Our app was no different, and most codepaths would make huge numbers of queries to the database, where those queries were about to become about 10x as expensive.
Going from 1ms to 10ms for every query was going to really suck, so our first question was whether this was even possible: did the app even function when queries took at least 10ms? What did that look like to a user of the app, was it even usable?
Using data
When changing a fundamental operation cost like this, it’s best to establish the lower bound of impact first, if only to rule out the plan entirely. If even the best case scenario is intolerable, there’s no point discussing things further – you’ll need another plan.
So before doing anything else, we wrote a QueryMonitor which added
instrumentation to the app, plugging into ActionSupport notifications about
ActiveRecord (the ORM) queries in order to measure the:
- Number of queries executed in a block
- Time spent executing those queries in total
We added it to the async worker code, to capture the database statistics from
running any async job and emit a job.database_statistics log when it
completes:
class Workers::BaseJob < Que::Job
  def run
    QueryMonitor.trace do
      super # run the job
    end
  ensure
    stats = QueryMonitor.collect
    log(
      event: "job.database_statistics",
      job_name: job_name,
      database_duration: stats.duration,
      database_query_count: stats.query_count,
    )
  end
end
Then did somthing similar in our Rack middleware:
ActiveSupport::Notifications.
  subscribe("start_handler.coach") do |_, event|
    QueryMonitor.trace # start tracing
  end

ActiveSupport::Notifications.
  subscribe("request.coach") do |name, event|
    stats = QueryMonitor.collect # collect and clear trace
    log(
      event: "api_request.database_statistics",
      handler: event[:handler],
      database_duration: stats.duration,
      database_query_count: stats.query_count,
    )
  end
After running this for a week, I downloaded the data from our logging cluster and built a spreadsheet for both workers and API requests that looked like this:
| Workload | Query count | Duration | Duration @5ms | Duration @10ms |
|---|---|---|---|---|
API::Payments::Create |
24 | 150ms | 270ms | 390ms |
Workers::SubmitPayments |
1,124,000 | 2,810s | 8,430s | 14,050s |
With a sprinkling of conditional formatting, the spreadsheets acted as a heatmap, making it clear which endpoints or jobs were the worst offenders. Printing them onto A3 poster paper, I visited each team and asked them to review the list for workloads they were responsible for, asking them to think carefully about how they’d adjust to each level of additional latency.
This exercise was really successful, with teams responding by:
- Reducing the number of queries their code made through use of joins and preloads
- Rearranging the scheduling of certain workers to ensure they finish in time
- Splitting some jobs into parallel workers, and adding capacity to make up for the slow down
We rebuilt the spreadsheet after these changes and concluded that this could be workable, if only for a short period of time. This was big! it meant the plan was viable, but it didn’t answer all our concerns.
Not that easy
Even with the data saying this should be fine, we’d made assumptions that were unlikely to be valid, and meant our projections were a best case scenario only. Probably the most critical and weakest assumption was that when something as fundamental as the minimum cost for every query changes, the rest of the system will continue otherwise unchanged: in other words, that the only thing the network delay caused was individual queries becoming a bit slower.
That’s unlikely to be true, and one of the things we worried about was how Postgres would respond in aggregate to longer individual queries. As an example, we ran Postgres with pgBouncer as a connection pooler, allowing the Rails app to share a small number of real Postgres connections with a much larger group of clients, shared on a transaction basis.
This is best practice for Postgres, as key parts of the database need to iterate through open connections to provide visibility guarantees: keeping the number of connections low avoids making that critical path slow, improving database health.
That’s great when your Rails app opens a transaction, issues a burst of quick queries and immediately releases the connection back to the pool, but the additional latency means we’re no longer doing that. That burst of queries is now taking at least query count * 10ms, causing our average transaction duration to increase, impacting the number of open connections in Postgres, impacting core database performance, etc…
Accomodating this would require us to make many changes, some basic – like measuring our new connection usage and increasing our connection limits to permit them – and others more subtle, like tweaking the database for a higher connection count (e.g. enabling huge-pages).
So while our data gave us confidence, there were still many questions we were yet to answer, all of which could blow up the plan. And given the amount of effort involved in performing this move, it would be good to be more confident in the approach before committing to the move itself.
This was the point at which testing and hypothesising could take us no further, and we needed to get our hands dirty to see how the systems actually behaved.
So how do we do that?
Time to experiment
As we anticipate certain issues will only appear at different levels of latency increase (e.g. 3ms, 7ms, 9ms) then any test must be able to gradually increase the latency. And because we know problems will occur, that latency should be easily reversible, so we can revert to normal operations while finding a longer term fix.
We decided to run an experiment over 1 week, which followed a process of:
- Check systems look healthy from:
- Purpose built dashboards showing database healthy, API and worker capacity, saturation, etc
- Compare some hollistic statistics to ‘healthy’ parameters we’d defined beforehand
- If healthy, increase latency by 1ms
- Wait a day to gather data
- Repeat until we reach 10ms
Adding artificial network latency could be done via iptables - the kernel network subsystem that controls all network packets - using a tool called tc (traffic control) which we ran on the primary Postgres node, targeting packets coming from the Rails app instances.
The tc command to add 3ms of latency would look like this:
tc qdisc add dev eth0 root netem delay 3ms
Just as expected, we hit problems at almost every additional 1ms of latency.
Sometimes it was simple, like workers overrunning, while others were more complex. At one point we added more workers to adjust for the latency, but that ate up our Postgres connections, so we increased the size of the pgBouncer pools which caused another process to execute much quicker, causing other problems!
Especially for the more complex issues, we could never have predicted them in advance: at least not in the detail we’d need to proactively fix them. It was much safer to find them in a controlled environment where we could easily rollback than it would have been during the real migration, with infrastructure split over two providers.
There was a hitch, though. While we’d checked our internal processes were ok, we happened to impact an API user who was submitting a big batch of payments just before our payment deadline, and was doing so in sequence with no parallelism.
While we offered no guarantee or advice on the performance of our API, in an example of Hyrum’s Law, this customer had come to rely on a very specific API performance in order to hit the payment deadline. As the API got slower, they moved closer to the deadline, and we had to abort the experiment to ensure they could make their end of month run.
This was difficult, and is the biggest downside of testing in production: shit happens, and sometimes things go wrong.
My biggest learning was this didn’t invalidate the experiment, or meant we’d made the wrong call. While painful at the time, this whole process had been about reducing risk for the entire customer base, and the counterfactual where we had a prolonged outage would have been much worse for all parties than a single customer being impacted.
That said, I keep this experience in mind whenever doing similar work now. I’m confident it was the right call, but it’s never comfortable when you’ve negatively impacted a customer.
Burned fingers, and a hope to do better next time!
If you liked this post and want to see more, follow me on LinkedIn.