
This post is also available in Russian at Сборка тестера нагрузки PostgreSQL, thanks to Vladimir for his work!
Some of my recent work at GoCardless uncovered a need to benchmark a Postgres cluster. In an attempt to simulate a realistic workload I wrote a tool that replays captured Postgres activity against a live server, providing an opportunity to predict how queries might degrade with configuration changes.
This post covers the implementation of pgreplay-go, a tool to realistically simulate captured Postgres traffic. I’ll explain why existing tools weren’t suitable and explain some challenges in the implementation, focusing on what I learned personally from the process.
Prior art
When faced with a technical problem it’s often better to use an existing tool than jump into writing one yourself. Having benchmarked Postgres clusters before, I was already familiar with a tool called pgreplay that I thought could do the job.
My benchmarking strategy with pgreplay is pretty simple: first capture logs from your production cluster that contain all executed queries then feed this to pgreplay which will replay those queries against the new cluster. Post-processing logs from the new cluster will show how the machines performed under production load, helping determine if changes are going to degrade performance.
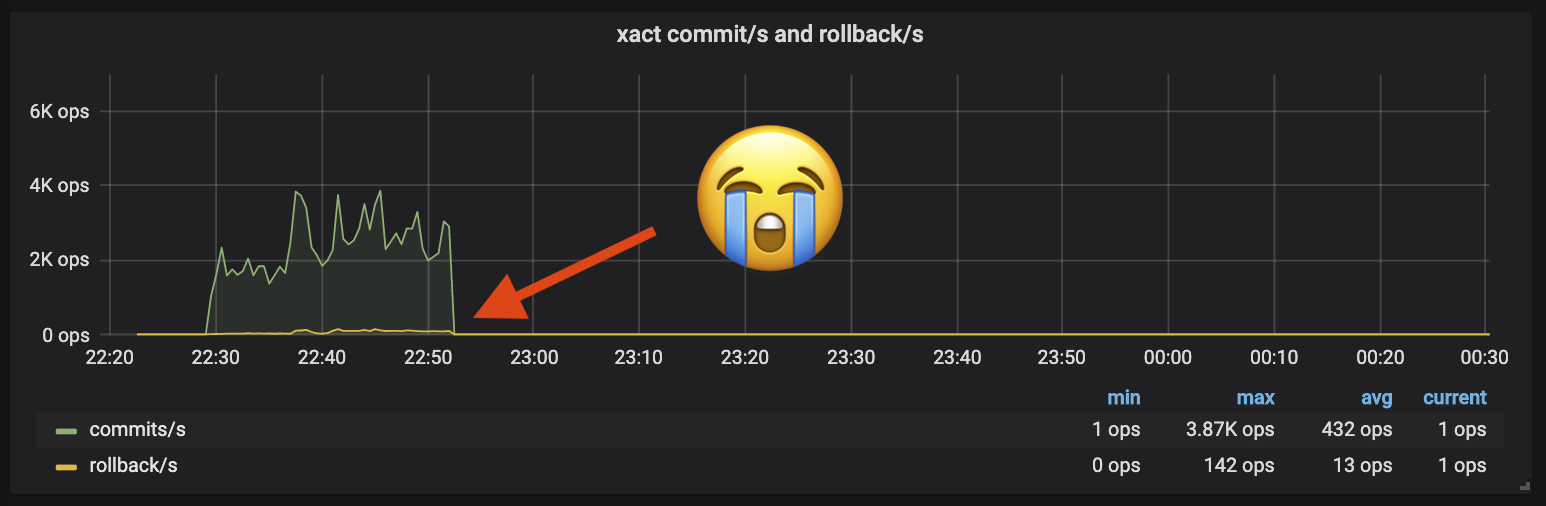
This process had worked well before but broke as soon as I applied it to this migration. Watching Postgres during a replay, there were spikes of activity followed by periods of quiet:
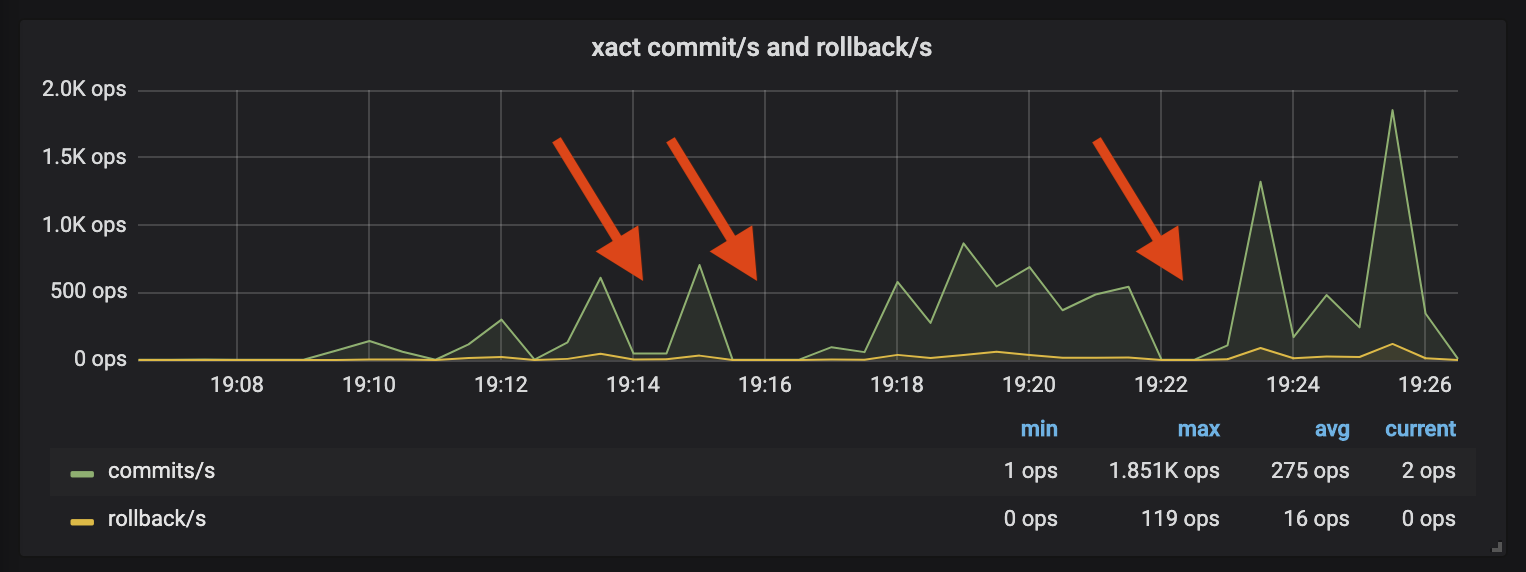
The new cluster was sufficiently different that several queries were now much slower than they had been in the original log capture. pgreplay will ensure queries execute in their original order- any queries that take longer to execute in the replay will block subsequent queries. The graph shows how several badly degraded queries caused pgreplay to stall, leading to the periods of inactivity.
Benchmarks can take several hours to execute and having the replay stall for problematic queries adds more time to an already slow process. The inactivity also impacts the realism of your tests- users don’t respond to a system under load by forming a queue and politely waiting for their first query to finish!
Implementation
So if this isn’t going to work, what might? It seemed to me a better replay strategy would be one that modelled each connection separately, where long-running queries would only impact their own connection. This allows us to measure the effect our degraded query has on other traffic by continuing with the rest of our replay.
Much like the original pgreplay, a tool that achieves this would have just a few components: a Postgres log parser which constructs the work to replay, a streamer that can pace execution to match the original logs and a database that can model on-going connections. The tool would need to be fast (perhaps a compiled language?) and use a runtime with cheap concurrency in order to model each connection.
We needed the benchmark results within a week, meaning there were three (leaving two days for running the benchmarks) days to build something that met these objectives. It would be close, but three days felt doable to create this Goldilocks replay tool, especially with a language I was already familiar with.
In a burst of optimistic naivety, I decided it was worth giving it a shot.
Log parsing: how hard can it be?
By necessity, we start by parsing the Postgres logs. I initially thought this would be easy and couldn’t have been more wrong!
Multi-line tokenising
When parsing logs you usually split the file by newlines to find each entry, but
the Postgres errlog format doesn’t work like this. As most log entries contain
newlines, the errlog format allows for newline characters by prefixing
continuation lines with a leading tab character (\t).
2019-02-25 15:08:27.239 GMT|alice|pgreplay_test|5c7404eb.d6bd|LOG:  statement: insert into logs (author, message)
	values ('alice', 'says hello');
Parsing this type of log is more fiddly than splitting on newlines. Instead of
scanning your file looking for a symbol (\n), you’re scanning until you see
your symbol not followed by an additional marker (\n not followed by \t).
This requires the scanner to look ahead of where the current token will
terminate, complicating the logic around when to split.
Given this was a small, simple project, I was keen to avoid heavy-weight
parser-generators that would require an additional build step. I instead reached
for the standard library to tokenise my log lines- after all, Go has an
interface called a Scanner for
exactly this purpose.
Several hours and some considerable frustration later, I had a splitter
function
full of error-prone mutation and a distinct feeling that strtok would have
been less painful. This was something I hadn’t considered when choosing Go for
the implementation, but the stdlib support for string manipulation is really
poor compared to what I’m used to. It caught me off-guard that Go would be so
poorly suited to the task.
Regardless, I now had something that could parse individual log entries and felt confident the worst was over. Next problem please!
Parsing log items (Simple vs Extended)
Holy crap, this did not work like I thought it would.
Postgres clients can opt to use one of two query protocols to issue commands against the server. The first is the simple protocol, where the client sends a text string containing the SQL with all parameters already interpolated into the query string. Simple queries will be logged like this:
[1] LOG: statement: select now();
These are easy- we parse the query from this line and execute it against the server. It’s the extended protocol that gets hard.
Extended query protocol provides safe handling of query parameters by divorcing
the SQL query from the injection of parameter values. The client first provides
the query with parameter placeholders, then follows with values for those
paramters. Executing select $1, $2 with parameters alice and bob would
yield the following logs:
[1] LOG:  duration: 0.042 ms  parse <unnamed>: select $1, $2;
[2] LOG:  duration: 0.045 ms  bind <unnamed>: select $1, $2;
[3] DETAIL:  parameters: $1 = 'alice', $2 = 'bob'
[4] LOG:  execute <unnamed>: select $1, $2;
[5] DETAIL:  parameters: $1 = 'alice', $2 = 'bob'
[6] LOG:  duration: 0.042 ms
Log lines 1, 2 and 3 represent the initial preparation of this query, where Postgres creates an unamed prepared statement and binds our two parameters. Query planning occurs during the bind stage but it’s at line 4 that we know our query has begun execution.
Ignoring all but 4 and 5, how would we parse these log lines into executable
instructions? We can see that logging the execution of a prepared statement is
immediately followed by a DETAIL log entry describing the parameter values,
but we’ll need to combine these together before we know what query to execute.
It’s now worth discussing the interfaces we’ll be using for parsing these logs.
The primary parsing interface is ParserFunc, which takes a Postgres errlog
file and produces a channel of replay Item’s, where an Item signifies an
actionable log entry that can be Handled by a database.
type ParserFunc func(io.Reader) (
    items chan Item, errs chan error, done chan error
)

var _ Item = &Connect{}
var _ Item = &Disconnect{}
var _ Item = &Statement{}
var _ Item = &BoundExecute{}

type Item interface {
    GetTimestamp() time.Time
    GetSessionID() SessionID
    GetUser() string
    GetDatabase() string
    Handle(*pgx.Conn) error
}
We expect to run our parser across very large (>100GB) log files and lazily
emit the parsed Item’s as soon as we parse them. Of the four categories of
Item we can parse, BoundExecute represents the combination of a prepared
statement and it’s query parameters.
As prepared statements with query parameters come in two log lines, it’s
possible for our parsing process to successfully parse a log line (like the
execute entry) without it being complete, as it lacks parameters. Modelling
this concept required another type to represent an Execute entry:
type Execute struct {
    Query string `json:"query"`
}

func (e Execute) Bind(parameters []interface{}) BoundExecute {
    return BoundExecute{e, parameters}
}
Unlike all the other types, Execute does not satisfy the Item interface as
it lacks a Handle method, so we’ll never be able to send it down our results
channel (chan Item). As we parse our items, we track the last recognised
Execute log line against each on-goinging connection’s SessionID and pass
this mapping to ParseItem so that it can match subsequent DETAIL entries
against unbound executes:
func ParseItem(logline string, unbounds map[SessionID]*Execute) (Item, error) {
    ...

    // LOG:  execute <unnamed>: select pg_sleep($1)
    // execute items are parsed incompletely and stored in our unbounds
    // map for later matching against DETAILSs.
    if strings.HasPrefix(msg, LogExtendedProtocolExecute) {
        unbounds[details.SessionID] = &Execute{details, parseQuery(msg)}
        return nil, nil // return nothing for now
    }

    // DETAIL:  parameters: $1 = '1', $2 = NULL
    // This log line should match a previously parsed execute that is
    // unbound. We expect to return the bound item.
    if strings.HasPrefix(msg, LogExtendedProtocolParameters) {
        if unbound, ok := unbounds[details.SessionID]; ok {
            // Remove the unbound from our cache and bind it
            delete(unbounds, details.SessionID)
            return unbound.Bind(ParseBindParameters(msg)), nil
        }
    }
}
By maintaining the unbound cache as part of a stateful parsing function we can
support the two-staging process of combining execute and detail lines into a
single replay item. By representing our Execute entry as a type without a
Handle method, we leverage Go’s type system to enforce and communicate the
incompleteness of this log entry, helping the compiler catch whenever these
items were incorrectly sent to the database to be replayed.
While tricky and much more complicated than I expected, it was nice to find a solution to the parsing that can be expressed well in Go’s type system.
Lazy streaming
Now we’ve parsed our logs, we need to replay items at the apparent rate they were originally executed. We can picture our benchmark as a pipeline of replay items, first being parsed then streamed at production rate and finally consumed by a database:
parse(logs) -> stream(replayRate) -> replay(database)
Ideally this replay tool would be so efficient that we could run it from the same box as the target Postgres without affecting our benchmark. This requires us to rate limit the parser to read only as much log as we currently need to replay, preventing us from trashing our disk parsing GBs of logs at the start of each benchmark.
The need to lazily consume our logs is why the parsing implementation returns a
chan Item that asynchronously receives parsed items. Sending a message down a
Go channel will block the calling goroutine until the message is consumed. We
can exploit this behaviour by implementing our streaming component as a consumer
of our parse channel, pulling items from the parser only when they
should be consumed according to their original log entry time.
With some detail removed, the implementation of Stream looks like this:
// Stream consumes items from the given channel and returns a channel
// that will receive those events at a simulated given rate.
func (s Streamer) Stream(items chan Item, rate float64) (out chan Item) {
  go func() {
    var first, start time.Time
    var seenItem bool

    for item := range items {
      // Calculate the time elapsed since we started our stream, adjusted
      // for our playback rate
      elapsedSinceStart := time.Duration(rate) * time.Now().Sub(start)

      // Time elapsed between the current and first item we processed
      elapsedSinceFirst := item.GetTimestamp().Sub(first)

      // If the amount of time from our first item to the current is
      // greater than our current stream runtime, sleep for that period
      // of time adjusted by our rate.
      if diff := elapsedSinceFirst - elapsedSinceStart; diff > 0 {
        time.Sleep(time.Duration(float64(diff) / rate))
      }

      // Now we've appropriately throttled, we can push the item
      out <- item
    }
  }()

  return
}
By measuring each item’s timestamp against the relative progress of our stream, we can send the item only when we know it’s due. Whenever we pause on an item that’s arrived early we stop pulling from our input channel, ensuring the upstream parsing pauses until we continue. The same goes for pushing down our out channel, where we’ll pause until our downstream database consumes the message.
Individual replay sessions
We’re now at our final component, where we replay our throttled execution items against the target database.
However we build this, we want to avoid the original problem where a single degraded query blocks the entire replay. The chosen strategy is to model each session individually, feeding items to each separately. Degraded queries will only block items that follow on the same session, avoiding the stop-the-world pauses we saw with our original benchmarking.
As with the streamer, we’ll pull items from our lazily supplied chan Item. The
Consume
function looks something like this:
func (d *Database) Consume(items chan Item) (chan error, chan error) {
  var wg sync.WaitGroup
  errs, done := make(chan error, 10), make(chan error)

  go func() {
    for item := range items {
      var err error
      conn, ok := d.conns[item.GetSessionID()]

      // Connection did not exist, so create a new one
      if !ok {
        d.conns[item.GetSessionID()] = d.Connect(item)
        wg.Add(1)

        // Start our connection control loop, asynchronously
        // processing items for its session
        go func(conn *Conn) {
          defer wg.Done()
          conn.Start()
        }(conn)
      }

      conn.In() <- item
    }

    // We've received every item, so close our channels
    for _, conn := range d.conns {
      conn.Close()
    }

    // Wait for every connection to terminate
    wg.Wait()

    close(errs)
    close(done)
  }()

  return errs, done
}
We map each Postgres session to its own goroutine, where we process items as
they come in from our streamer. sync.WaitGroup
is used to wait for all our connections to terminate before signalling that
we’re finished.
As each connection could potentially receive thousands of items while running a
degraded query, we need channels that have an ‘infinite’ buffer. Go has no
native support for this, but the
eapache/channels library provides an
InfiniteChannel
type that works just fine.
Debugging
After a couple of days hacking this together, I finally had something that (fingers crossed!) could achieve what we were looking for. I’d already collected the logs so got to work setting up our benchmark machine.
Parser performance (15MB/s -> 340MB/s)
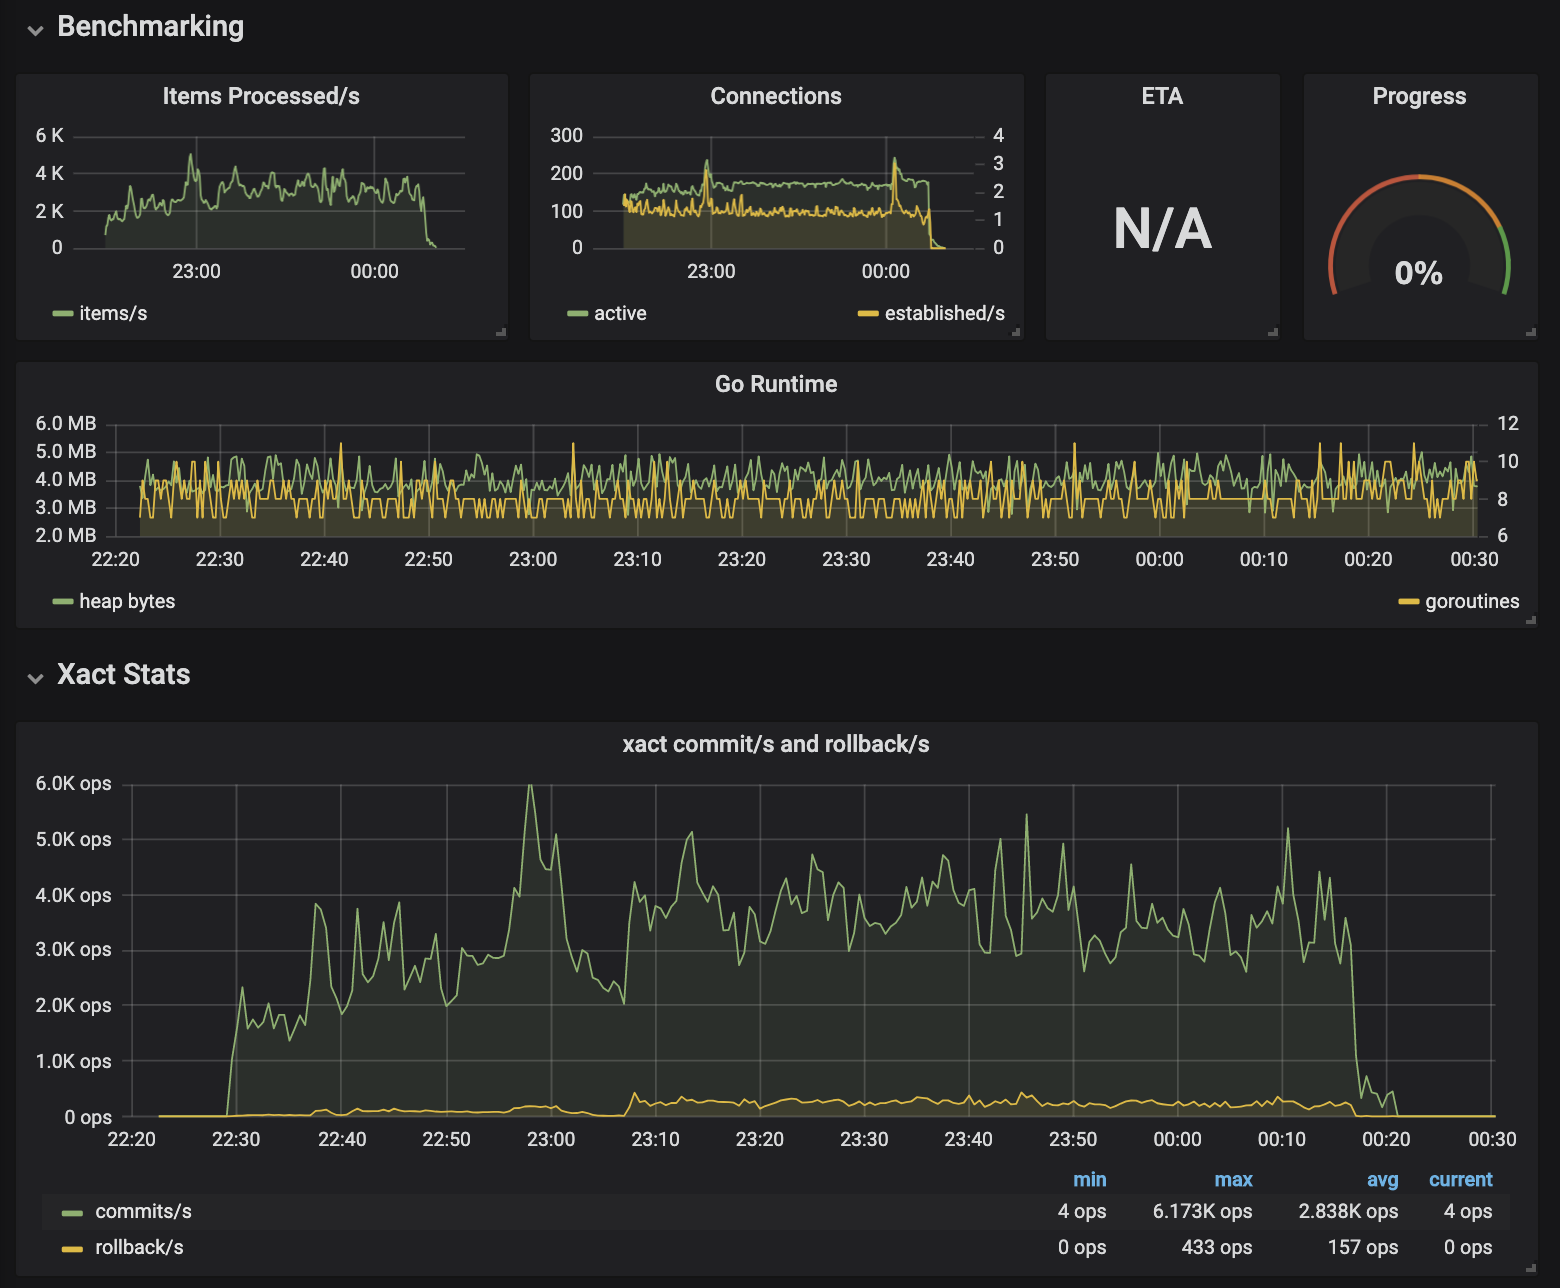
First impressions were great: watching the Postgres metrics of the machines showed a constant level of activity that was free of the start-stop behaviour we’d seen with the original pgreplay tool. Things looked less rosy when comparing the figures to production, where the peak op/s were 4x what was seen during the benchmark run.
Something wasn’t keeping up with our benchmark capture. On a hunch, I modified the pgreplay code to take no action on parsed items and tried running a replay while measuring the speed it read the log file. Unsurprisingly, we were parsing our logs much slower than I’d hoped…
$ pv --rate postgresql.log | pgreplay run --errlog-input /dev/stdin
ts=2019-04-06T19:15:27.045501Z caller=level.go:63 event=metrics.listen address=127.0.0.1 port=9445
[15.5MiB/s]
The production instance that produced the benchmark logs would occassionally burst logs at 30MB/s. If we maxed out at 15MB/s when parsing logs then our replay would be totally unable to replicate the production traffic.
Luckily Go has great support for profiling and a compiler that can provide
optimisation hints. Running go build with -gcflags '-m' will turn on escape
analysis warnings which can help catch optimisation issues.
$ go build -gcflags '-m' parse.go
./parse.go:249:16: func literal escapes to heap
./parse.go:248:29: &bufio.Scanner literal escapes to heap
./parse.go:247:20: leaking param: input to result ~r1 level=-1
./parse.go:178:16: func literal escapes to heap
./parse.go:177:47: strings.NewReader(input) escapes to heap
./parse.go:177:47: &strings.Reader literal escapes to heap
...
Writing performant code for languages with automated memory management often requires avoiding memory allocations. In the perfect world, all function variables would be allocated on the stack, as stack-allocated variables have no garbage-collection overhead as they get released automatically when the function returns.
My initial attempt at parsing was a great example of how not to optimise for memory allocations. Selecting one of the poorer snippets:
func ParseBindParameters(input string) ([]interface{}, error) {
    parameters := make([]interface{}, 0)
    prefixMatcher := regexp.MustCompile(`^(, )?\$\d+ = `)

    scanner := bufio.NewScanner(strings.NewReader(input))
    scanner.Split(func(data []byte, atEOF bool) (int, []byte, error) {
        ...
    }

    ...
}
In this extract we’ve supplied an anonymous function to Split which has a
closure over the parameters and prefixMatcher variables in the outer
function scope. As anonymous functions can outlive their parent, all variables
they reference are ruled out for stack allocation, to avoid releasing them
before they are used. Go’s escape analysis made it clear our variables were
heap allocated by screaming X escapes to the heap, and it’s sensible to assume
this will majorly affect parsing performance.
I went through each warning turning anonymous functions into static package functions and reducing (where possible) my use of heap allocated objects. This and a couple of changes to add buffers saw our parsing speed increase by 16x to 346MB/s:
$ pv --rate postgresql.log | pgreplay run --errlog-input /dev/stdin
ts=2019-04-06T19:58:18.536661Z caller=level.go:63 event=metrics.listen address=127.0.0.1 port=9445
[ 346MiB/s]
Deadlocks and segfaults
I was now so close to a functional benchmark, and what I could see from our metrics was giving me real hope. My test benchmarks would start with the same amount of activity as production in our target cluster, until…
While close, dying just 20m into a 3hr benchmark isn’t going to cut it. After losing some hours debugging deadlocks and segfaults it became clear I needed more visibility. Go is known for many things but fearless concurrency is not one of them- so many things could be going wrong that guessing wasn’t getting me far without more information.
I skimmed through each component of the pipeline and added simple Prometheus metrics that helped me understand which stage was jamming. Along with my custom metrics came the Go runtime stats which usefully tracks goroutine activity, aiding deadlock debugging. This new information allowed me to track down the remaining problems until I could successfully execute a multi-hour benchmark.
Conclusions
Revisiting why I’d started this work, pgreplay-go solves my issues with pgreplay and allowed me to confidently test a new Postgres cluster. Not only did it get the results my team had needed, the journey from initial commit to functioning tool happened within the five day timeline I’d set out from the start.
Beyond just solving the problem I enjoyed being wrong with every one of my assumptions about how easy this task would be to solve. It was entertaining in a silly way when nothing quite worked how I expected it to, and I really enjoyed debugging each problem as it came along.
In terms of learning, I now know a lot more about Postgres logging and connection protocols. It was also an opportunity to practice my Go programming and became more familiar with optimising my code. Finally, implementing Prometheus metrics even for such a small project reminded me of how cheap an investment observability can be for the huge value you get once you have it setup.
The full source code and compiled binaries for pgreplay-go can be found here. Readers can look forward to future GoCardless posts about the outcome of the PostgreSQL benchmarking!
Discuss this post on Hackernews. If you liked this post and want to see more, follow me on LinkedIn.