
Many web applications consist of a web server which handles live traffic and some sort of background worker tier that can process work asynchronously. There’s a lot of great advice on how to measure the health of live web traffic, and the community continues to develop tools like Prometheus that can help support this instrumentation.
But looking past web traffic, our workers are often as—if not more—critical to service health. We should care about and measure these too, but there’s little guidance about how to do so while avoiding common pitfalls.
This post explores one of the pitfalls often found when measuring async work, using the example of a production incident where despite having metrics it was not possible to accurately determine what workers were doing. The metric implementation had created a bias so significant that the metrics were outright lying, rendering them unusable.
We’ll see how to adjust the implementation to provide accurate measurements, and conclude with an open-source reference implementation of a prometheus-client-tracer you can use in your own applications.
The incident
Alerts were firing for increased HTTP error rate, and the dashboards confirmed it- queues were building and requests timing out. About two minutes later the queues cleared and normality was restored.
Looking closer, our API servers had stalled waiting on the database to respond, causing all activity to grind to an abrupt halt. Given most database heavy work happens in the asynchronous worker tier, the workers were the obvious prime suspect. The natural follow-up is to ask what on earth the workers were doing?
The workers expose a Prometheus metric that tracks how they spend their time. It looks like this:
# HELP job_worked_seconds_total Sum of the time spent processing each job class
# TYPE job_worked_seconds_total counter
job_worked_seconds_total{job}
By tracking the sum of seconds spent working each job type, the rate at which the metric changes can identify how much worker time has been consumed. An increase of 15 over an interval of 15s implies a single continuously occupied worker (one second for every second that elapses) while an increase of 30 would imply two workers, etc.
Graphing worker activity during this incident should show us what we were up to. Doing so results in this sad graph, with the time of incident (16:02-16:04) marked with an appropriately alarming red arrow:
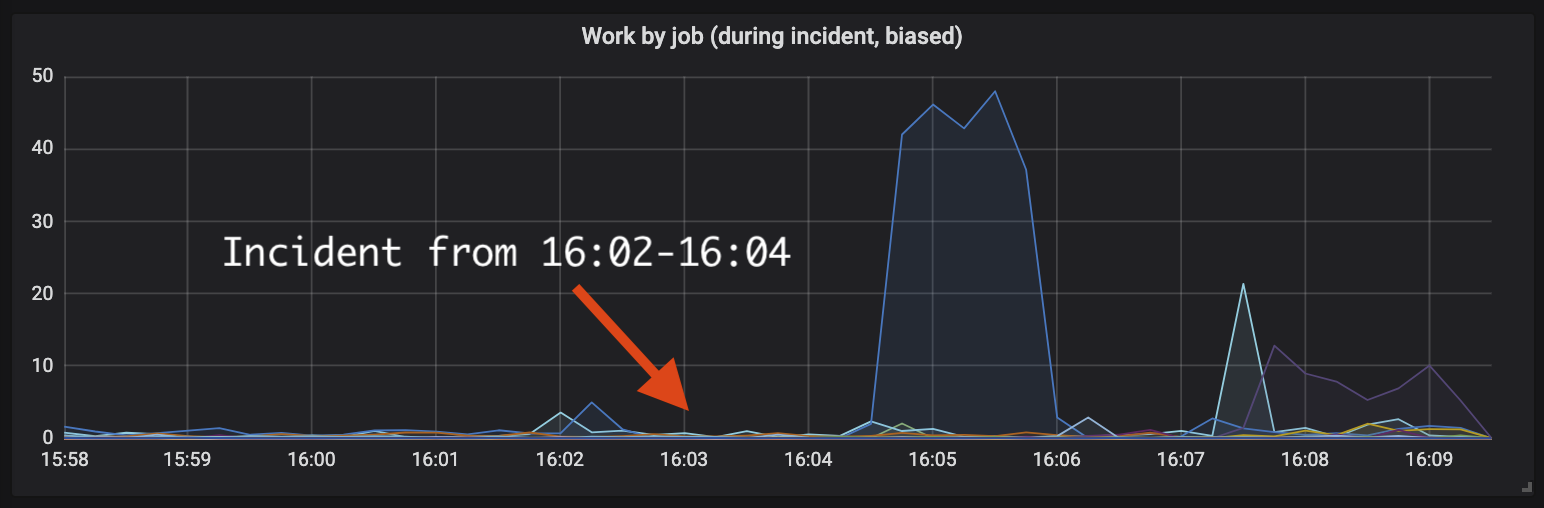
As the person debugging this mess, it hurt to see the graph drop to minimal activity at the exact time of the incident. This is time spent working webhooks, for which we run twenty dedicated workers. I knew from the logs that all the workers were busy, so I’d expect the graph to be close to 20s, and yet it almost flatlines. More than this, that large blue spike at 16:05? How could twenty single threaded workers spend 45s per second working, as the graph implies?
Where it went wrong
The incident graph is lying to us by both hiding and over-reporting work depending on where you take the measurement. Understanding why requires us to consider the implementation of the metric tracking and how that interacts with Prometheus taking the measurements.
Starting with how workers take measurements, we can sketch an implementation of the worker process below. Notice that workers will only update the metric after the job has finished running.
class Worker
  JobWorkedSecondsTotal = Prometheus::Client::Counter.new(...)

  def work
    job = acquire_job
    start = Time.monotonic_now
    job.run
  ensure # run after our main method block
    duration = Time.monotonic_now - start
    JobWorkedSecondsTotal.increment(by: duration, labels: { job: job.class })
  end
end
Prometheus (with its pull-based metrics philosophy) makes a GET request to each worker every 15s to record the metric values at the request time. As workers constantly update the job worked metric, over time we can plot how this value has changed.
We start seeing our over/under-reporting issue whenever jobs execute across a scrape boundary, where scrapes happen every 15s. Imagine a job that begins execution 5s before a scrape and finishes 1s after- in total, the job executes for 6s, but that 6s is only visible in the measurement taken after the scrape, despite 5s of work happening before that point.
This effect becomes even more exaggerated when jobs take longer than the scrape interval (15s). During the execution of a 1m job, Prometheus will scrape the worker four times, but the metric is only updated after the fourth scrape.
Drawing a timeline of worker activity can make it clear how the moment we update our metric affects what Prometheus sees. In the diagram below, we map the timeline of two workers into chunks that represent jobs of varying duration. Two Prometheus scrapes are labelled at 15s (red) and 30s (blue), with the jobs that contribute to the metric value at each scrape coloured accordingly.

Irrespective of what they work, two fully occupied workers will perform 30s of work in every 15s interval. As Prometheus doesn’t see work until it’s complete, our metric implies 14s of work happened in the first interval and 42s in the second. If every worker starts working long jobs, we’ll report no work being done until they end, even if that’s hours later.
To demonstrate this effect, I created an experiment with ten workers working jobs of varying duration half-normally distributed between 0.1s and some upper duration boundary (see seed-jobs). Here are three graphs of reported worker activity, each with increasing job durations.
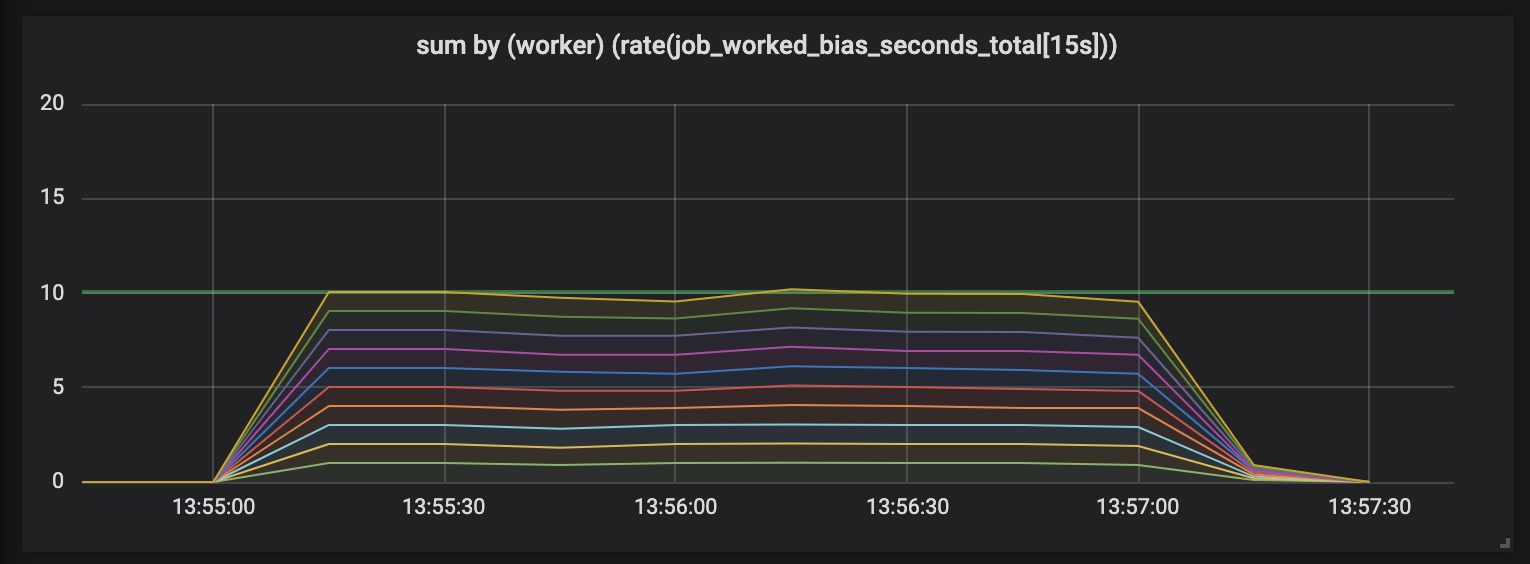
The first graph shows each worker working approximately 1s of work every second, as indicated by the flat lines, and the total work equaling our capacity (ten workers providing ten seconds of work, every second). This is what we should expect regardless of job duration, as constantly occupied workers do just as much work per second for short jobs as for long.
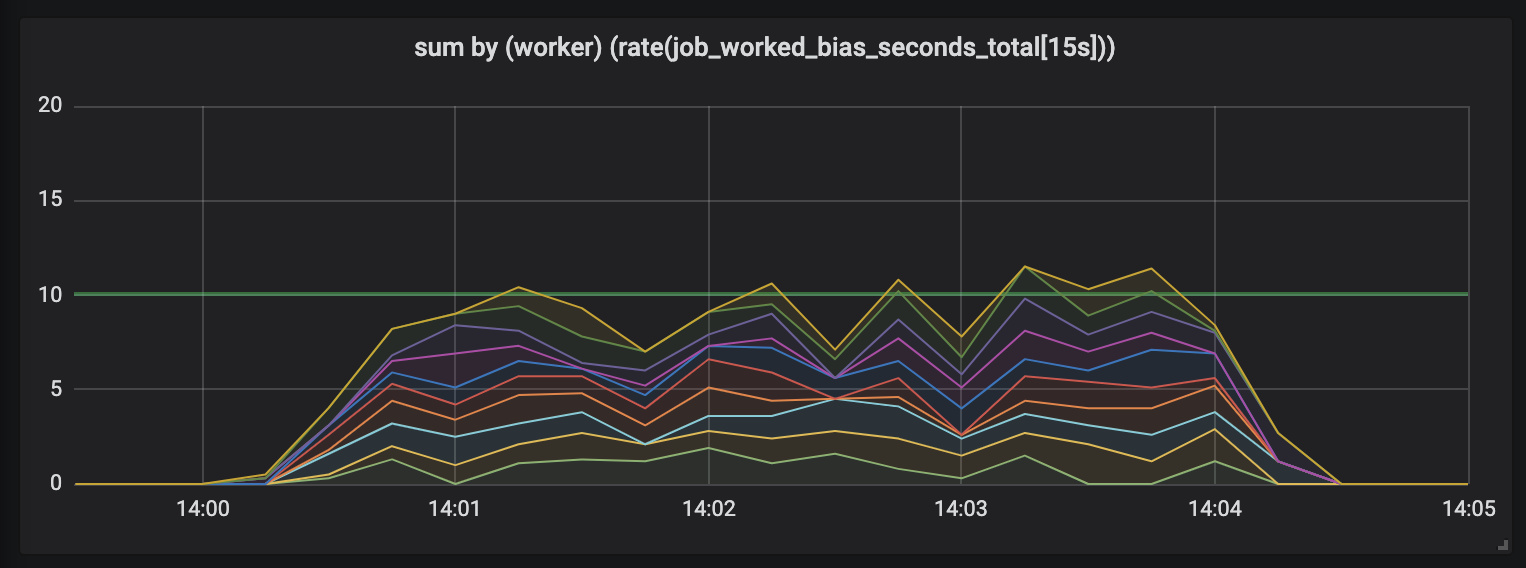
As the job duration increases, our graph becomes messy. We still have ten workers and they’re still constantly working, but the total work seems to jump above and below the available capacity (10s).
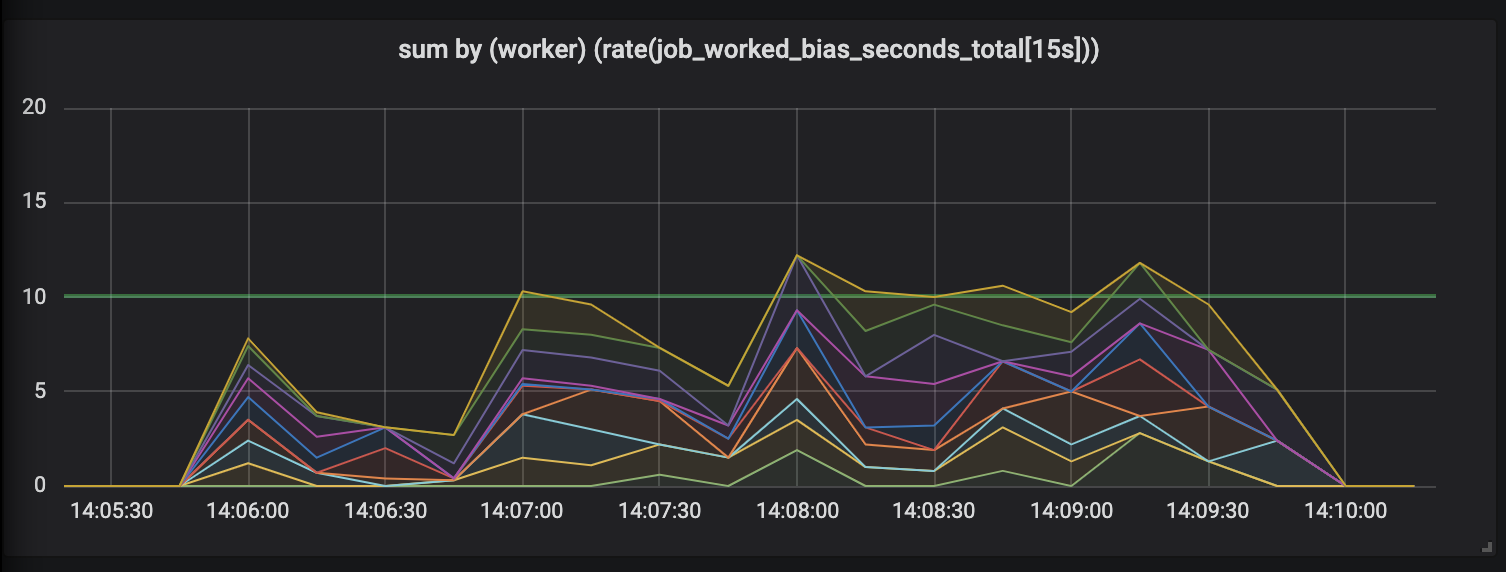
With jobs of up-to 30s duration, our measurements become ridiculous. This biased metric records no work while we work the longest of jobs, and place spikes of activity only after they’ve subsided.
Restoring trust
As if this wasn’t bad enough, there’s an even more insidious problem with the long-lived jobs that so screw with our metrics. Whenever a long-lived job is terminated, say if Kubernetes evicts the pod or a node dies, what happens with the metrics? As we update metrics only after completing the job, as far as the metrics are concerned, all that work never happened.
Metrics aren’t meant to lie to you. Beyond the existential crisis prompted by your laptop whispering mistruths, observability tooling that misrepresents the state of the world is a trap and not fit-for-purpose.
Thankfully this is fixable. This bias occurs because Prometheus takes measurements independently of workers updating metrics. If we can ask workers to update metrics whenever Prometheus scrapes them, just before they return scrape results, then we’ll ensure Prometheus is always up-to-date with on-going activity.
Introducing… Tracer
One solution to the time-of-measurement bias is a Tracer, an abstraction
designed to take long-running duration measurements while incrementally updating
the associated Prometheus metric.
class Tracer
  def trace(metric, labels, &block)
    ...
  end

  def collect(traces = @traces)
    ...
  end
end
Tracers provide a trace method which takes a Prometheus metric and the work
you want to track. trace will execute the given block (anonymous Ruby
functions) and guarantee that calls to tracer.collect during execution will
incrementally update the associated metric with however long had elapsed since
the last call to collect.
We need to hook the tracer into the workers to track the job duration and the
endpoint serving our Prometheus scrape. Starting with workers, we initialise a
new tracer and ask it to trace the execution of acquire_job.run.
class Worker
  def initialize
    @tracer = Tracer.new(self)
  end

  def work
    @tracer.trace(JobWorkedSecondsTotal, labels) { acquire_job.run }
  end

  # Tell the tracer to flush (incremental) trace progress to metrics
  def collect
    @tracer.collect
  end
end
At this point, the tracer will only ever update the job worked seconds metric at the end of the job run, as we did in our original metric implementation. We need to ask the tracer to update our metric before we serve the Prometheus scrape, which we can do by configuring a Rack middleware.
# config.ru
# https://rack.github.io/

class WorkerCollector
  def initialize(@app, workers: @workers); end

  def call(env)
    workers.each(&:collect)
    @app.call(env) # call Prometheus::Exporter
  end
end

# Rack middleware DSL
workers = start_workers # Array[Worker]

# Run the collector before serving metrics
use WorkerCollector, workers: workers
use Prometheus::Middleware::Exporter
Rack is a Ruby webserver interface that allows chaining several actions into a
single endpoint. The above config.ru defines a Rack app that, whenever it
receives a request, will first call collect on all the workers, then have the
Prometheus client render scrape results.
Returning to our diagram, this means we update the metric whenever the job ends or we receive a scrape. The jobs that span across scrapes contribute fairly on either side, as shown by the jobs straddling the 15s scrape time splitting their duration.

Is it better?
Using the tracer has a night-and-day impact on how worker activity is recorded. Unlike the original measurements where our activity was spiky, with peaks that exceeded the number of workers we were running and periods of total silence, re-running our experiment with ten workers produces a graph that clearly shows each worker contributing evenly to the reported work.
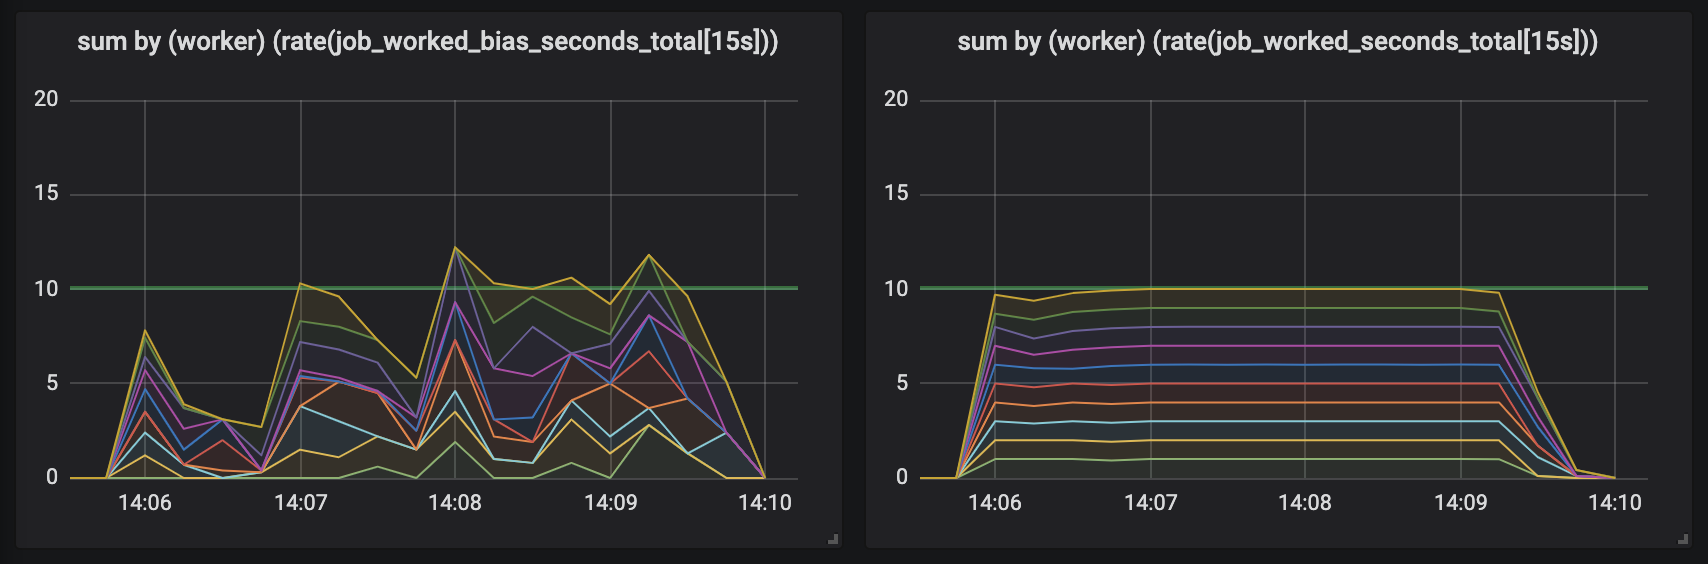
In comparison to the outright misleading and chaotic graph from our original measurements, metrics managed by the tracer are stable and consistent. Not only do we accurately assign work to each scrape but we are now indifferent to sudden worker death: Prometheus will have recorded the metric up until the worker disappears, ensuring that work doesn’t go unreported if the worker goes away.
Can I use this?
Yes! The Tracer interface is something I’ve found useful across multiple
projects and have extracted into a separate Ruby gem,
prometheus-client-tracer.
If you use the Prometheus client in your Ruby applications, just add
prometheus-client-tracer to your Gemfile then:
require "prometheus/client"
require "prometheus/client/tracer"

JobWorkedSecondsTotal = Prometheus::Client::Counter.new(...)

Prometheus::Client.trace(JobWorkedSecondsTotal) do
  sleep(long_time)
end
If you find this useful and would like to see a Tracer provided with the
official Prometheus Ruby client, drop your feedback in
client_ruby#135.
Final thoughts
I hope this will help people become more aware of how they measure long-running tasks, and unveil one of the common issues that occur when doing so. It should also be clear that this problem isn’t just for asynchronous work- if your HTTP requests can get slow, they’ll also benefit from using a tracer to track time spent working.
As always, any feedback or corrections are welcome- reach out on Twitter or open a PR. If you’d like to contribute to the tracer gem, the source code can be found at prometheus-client-tracer-ruby.
Discuss this post on Hackernews. If you liked this post and want to see more, follow me on LinkedIn.