
Of all the changes I’ve seen over GoCardless’ adolescence, one of the most impactful has been collecting all our data into a single place.
Thanks to an extraordinary effort across many teams, we went from all our data being inside a single Postgres database to all our data sources- Postgres, MySQL, Salesforce, Slack, even our HR platform- being loaded into datasets inside Google BigQuery.
For those who haven’t worked with a setup like this, it’s difficult to overstate how transformational it can be. Tools like BigQuery can analyse terabytes of data in seconds, making complex analysis a casual exercise.
I think this is really cool, and I’m going to try convincing you by sharing an example where 2hrs of analysis helped prioritise 2-4 weeks of engineering work. We’ll end up with query that joins across two very different datasources, which you can preview at this post’s sample Gist.
Should we send fat webhooks?
As some background, GoCardless sends webhooks to integrators, informing them whenever something happens to their account.
An example of a payment created event might look like this:
{
  "id": "EV001X2XMQXG73",
  "resource_type": "payments",
  "action": "submitted",
  "links": {
    "payment": "PM000ESVVBV1R3",
    "organisation": "OR00002CC2G5CG"
  },
  "details": {
    "origin": "gocardless",
    "cause": "payment_submitted",
    "bank_account_id": "BA00006XZ7SRNV",
    "description": "Payment submitted to the banks. As a result, it can no longer be cancelled."
  }
}
You’ll notice that the event speaks only of the payment ID (PM000ESVVBV1R3)
rather than providing a copy of the payment inline. This omission is deliberate,
intended to encourage integrators to reach back to the GoCardless
API to fetch the most up-to-date version of a resource instead
of using potentially stale data.
But this means GoCardless does the work to serialize and send the webhook, just for the receiver to come back the GoCardless API and request the full version of these resources:
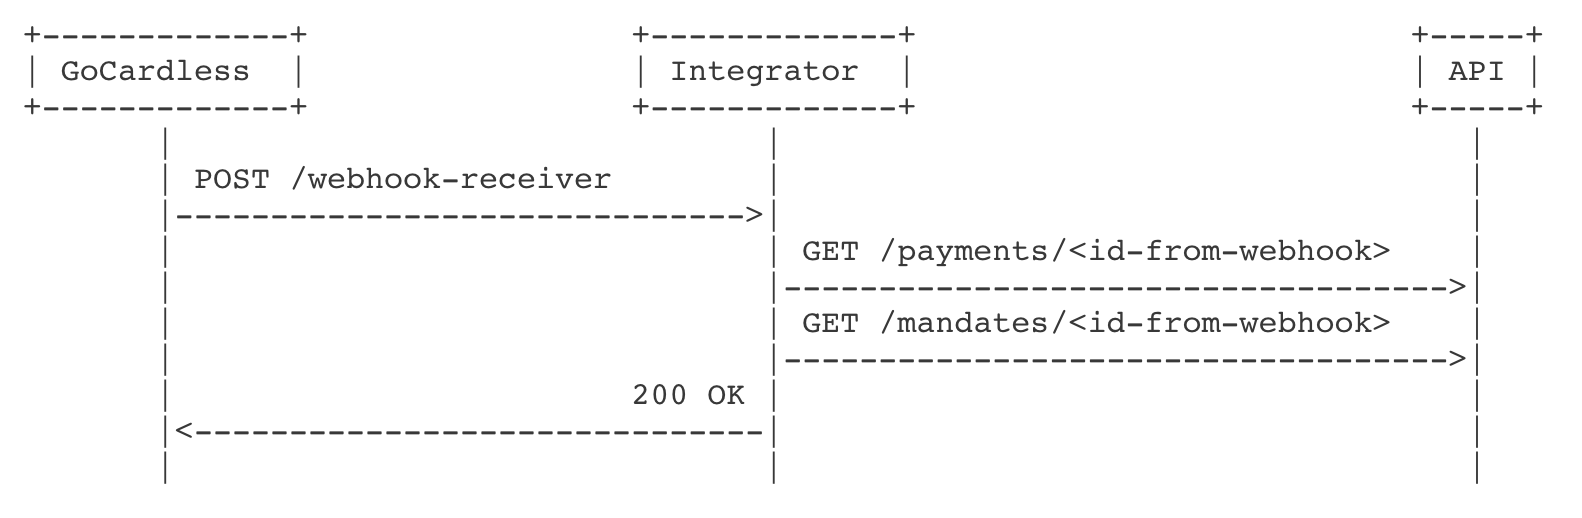
In questioning optimisations, we wondered whether we should fully serialize resources into the webhook payload, instead of referencing them by ID, allowing an integrator to avoid calling back into our API.
Before we ever consider this, though, we need to know how many API requests could be attributed to this behaviour. Without the data, we could be vastly overestimating the number of integrators who make requests in this manner.
Webhook callbacks, how much do they cost?
Our goal is to understand if these webhook callback requests consume a significant amount of our API capacity. If the cost is negligible, then it makes more sense to prioritise work to optimise our API than to remove this workload.
We really want to understand the percentage of API work (seconds spent responding) that goes to webhook callback requests.
Unfortunately, we have no way of knowing if a request made by an integrator is
in response to receiving a webhook. We have no telemetry–nor can I imagine what
this would look like–that could tell us “I’m GET’ing /payments/PM123 because I
just saw PM123 in a webhook”.
While we can’t be certain, we can make some assumptions about user behaviour that can help us guess a relationship. You’ll find examples of these assumptions in a load of useful metrics, such as the Google GSuite team’s definition of user uptime: Meaningful Availability.
Because we encourage integrators to use webhooks over polling, it’s reasonable to assume any request for a specific resource immediately after creation is in response to a webhook. After all, how would you know the ID unless you’d been told?
With this, we can say:
Requests are considered webhook related if they access a specific resource, and were made within 3 minutes of sending a webhook that referenced the same resource
Now we explore our data to see how we can use this.
Choosing your data
The thrust of this article is that a connected dataset is worth more than the sum of its parts. By exporting such a variety of data sources in BigQuery, we can combine them in ways that aren’t practical to predict in advance.
We’ll combine two such sources to answer our question: the webhooks table of
our relational Postgres database, and HTTP request logs.
webhooks
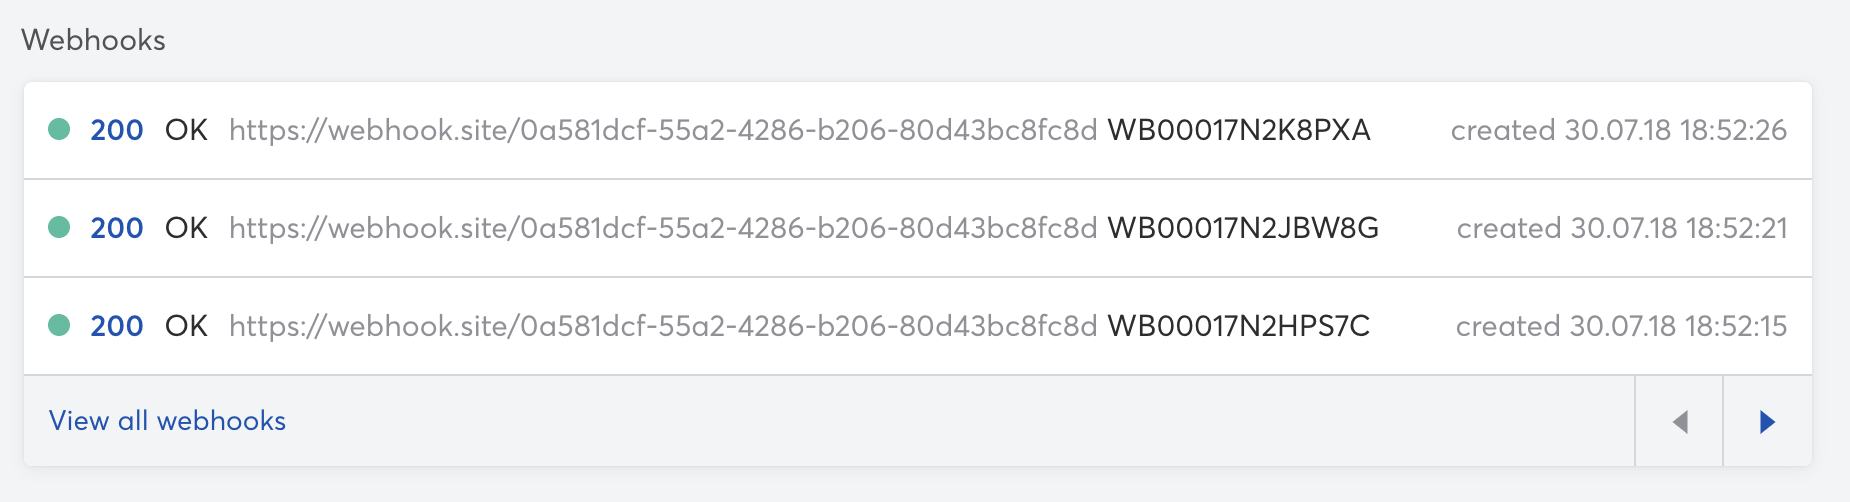
As a developer configuring webhooks, it’s really useful to see what is being sent. Often you screw up the endpoint or your receiver is failing for some reason, problems that become clear when you can see things from the senders perspective.
For this reason, we have a view in the GoCardless dashboard that shows exactly this:
To provide this view, we store webhook requests and responses in a webhooks
table of the database that powers our API. Each webhooks row has a
request_body field, which is a string containing the JSON body of the request,
in which we’ll find our resource IDs.
psql=> select id, url, request_body from webhooks limit 1;
-[ RECORD 1]+-----------------------------------------------------------
id           | WB0001J9R226EM
url          | https://webhook.site/f345c389-a70a-48e1-8548-9bf2efea5fbc
request_body | {
                 "events": [{
                   "id": "EV001X3873HCX9",
                   "links": {
                     "payment": "PM000EWZC0KAJX"
                   },
                   ...,
                 }]
               }
This Postgres database belongs to our monolithic payments service, an application which powers a significant part of our product. Unsurprisingly, this was one of the first data sources exported to BigQuery, so we can easily use this table for our analysis.
merchant_activity
To analyse API requests, we’d normally reach for HTTP logs from our servers.
GoCardless uses Elasticsearch to store application logs, which are collected
from the STDOUT of processes.
Elasticsearch encourages you to think about your logging schema- if you don’t, you tend to lose logs. As much pain as this caused, our push for standardising log schemas meant writing a tool that could intercept the application logs and push them into BigQuery was an easy win.
The application log we’re interested in is the merchant_activity event, which
you can think of as a plain HTTP request log-line with additional information
added after authentication. We’re interested in GET requests to specific
resources, something like GET /payments/PM123. For these requests, we log a
resource_id field specifying the resource accessed, looking like this:
{
  "_log_timestamp": "2020-10-30 16:21:14.818 UTC",
  "method": "GET",
  "handler": "Routes::Payments::Show",
  "duration": "0.024530284",
  "resource_id": "PM000EWZC0KAJX"
}
Connecting the dots
Now we have our data, we can begin crunching it. If it’s easier, you can see the full BigQuery query here, and I’ll explain piece-by-piece below.
We’re aiming to produce a dataset of:
-
timestamp, group requests by the minute (eg.
2020-10-29 00:01:00 UTC) - duration, sum of all request durations in seconds (eg. 436.4s)
- webhook_work_duration, sum of all webhook callback request durations (eg. 5.95s)
- work_ratio, fraction of work for webhook callbacks (1.36%)
First, we need to extract the resource IDs from our webhooks table where the
JSON request body is stored as a string in the request_body field.
Manipulating large blobs of JSON isn’t that SQL friendly, but thankfully
BigQuery supports Javascript functions (BigQuery: Standard SQL user-defined
functions) which can much more flexibly use
this JSON.
We’ll define a function extractIDs, which can pull all the references resource
IDs from the request_body field:
/*
extractIDs takes the webhook request payload, which is structured like so:
{
  "events": [
    { "links": { "<resource-name>": "RES123", ... } },
    ...,
  ]
}

And extracts the unique set of resource IDs referenced by the webhook.
*/
CREATE TEMP FUNCTION
  extractIDs(json STRING)
  RETURNS ARRAY<string>
  LANGUAGE js AS """
  return [
    ... new Set(
      JSON.parse(json)["events"]
        .map(e=>Object.values(e["links"]))
        .flat()
    )
  ];
""";
Once defined, we can use this function natively inside of any standard SQL
query. We’re going to want to create a CTE called webhook_resources, which
takes each row from webhooks and generates a new row per resource ID inside
the webhooks.request_body.
WITH
  -- Expand each webhook into a row per resource ID from the request_body
  -- payload. Use the Javascript extractIDs function to parse all the events,
  -- then UNNEST the parsed array into separate rows.
  webhook_resources AS (
  SELECT
    id,
    created_at,
    resource_id
  FROM (
    SELECT
      id,
      created_at,
      extractIDs(request_body) AS resource_ids
    FROM
      webhooks ) AS webhook_resources
    -- UNNEST transforms the array of resources IDs into a row per resource ID,
    -- while the CROSS JOIN finds every pairing from the original webhook (1) to
    -- every resource ID (n).
    CROSS JOIN
    UNNEST(resource_ids) AS resource_id
  ),
That gets us the webhook resources, and this is where we’re about to leverage
the connected data concept to join our Postgres data (webhooks) onto
application logs (merchant_activity).
We’ll join the two sources on a condition that expresses our previous assumption: that requests are webhook related if they happen within 3m of sending a webhook that referenced the request resource.
  -- Join each HTTP request log onto webhook_resources. Set the
  -- webhook_work_duration field to be the duration of the request, if we can
  -- find a webhook that was sent within 3m either side of the request.
  requests AS (
  SELECT
    merchant_activity._log_timestamp AS timestamp,
    merchant_activity.handler,
    merchant_activity.resource_id,
    merchant_activity.duration,
    -- Set any non-webhook related requests webhook work to be 0.0
    (
      CASE webhook_resources.resource_id IS NULL
      WHEN TRUE THEN 0.0
      ELSE merchant_activity.duration
      END
    ) AS webhook_work_duration
  FROM
    merchant_activity
  -- OUTER JOIN to ensure we produce a row for every merchant_activity entry, as
  -- we'll want to understand the ratio of webhook work to other API activity,
  -- which is best measured in duration spent serving each request.
  LEFT OUTER JOIN
    webhook_resources
  -- Allow for matching against a request either side by 1m of our API request.
  -- This permits for slippage, as the log has a timestamp set at the completion
  -- of a request and some integrators may respond to webhooks inline, rather
  -- than asynchronously.
  ON
    webhook_resources.resource_id=merchant_activity.resource_id
    AND ABS(UNIX_SECONDS(_log_timestamp) - UNIX_SECONDS(created_at)) < 180
    AND merchant_activity.resource_id IS NOT NULL
  )
Finally, we’re going to compute the results for each 1m interval in a sample day. This will get us ratios that we can roll-up after the fact, once we’ve generated the result set we’re interested in.
-- Present work ratio rolled-up to each minute of our results. Provide total
-- durations so we can perform additional roll-ups later.
SELECT
  TIMESTAMP_TRUNC(timestamp, MINUTE) AS timestamp,
  COUNT(*) AS count,
  SUM(duration) AS duration,
  SUM(webhook_work_duration) AS webhook_work_duration,
  SUM(webhook_work_duration) / SUM(duration) AS work_ratio
FROM
  requests
GROUP BY
  1
ORDER BY
  1;
The BigQuery SQL runner can show us these results in tabular format:
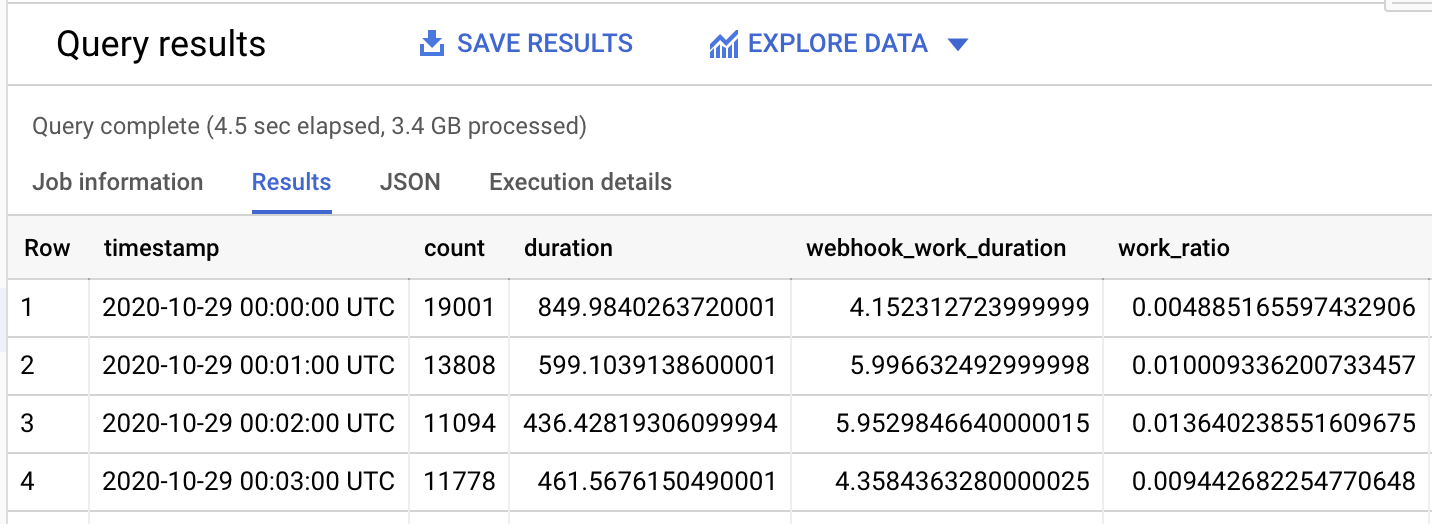
…which is almost useless, unless you’re extremely gifted at mental visualisation.
I’m not, so I exported this data into Grafana, graphing the total amount of API work (yellow) against the percentage spent on webhook callbacks (green):
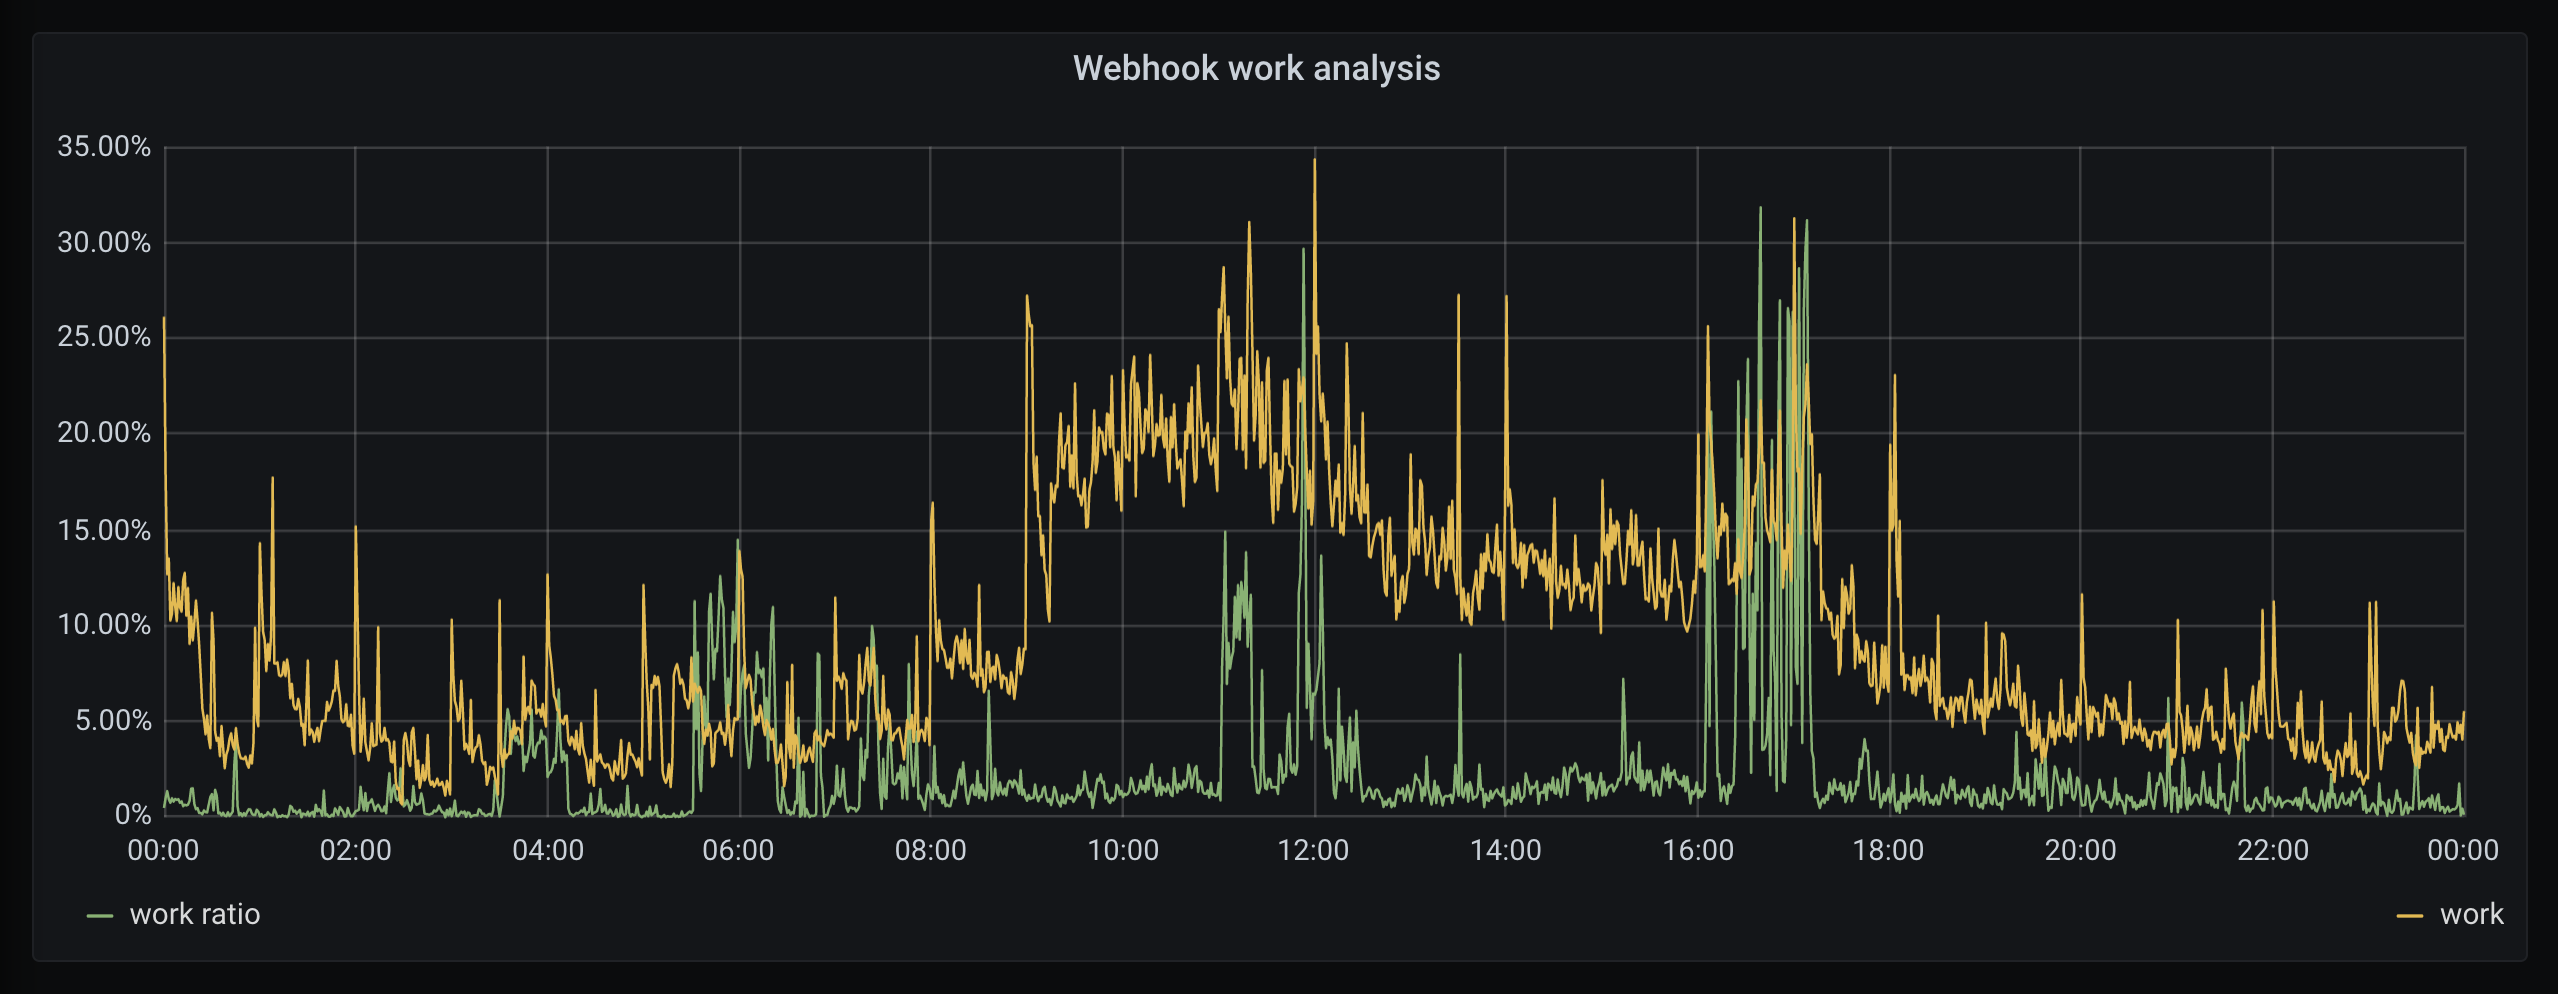
If webhook callbacks are significant, we expect high work ratio alongside a high total of work. We can see peaks (12am, 4pm) where we are processing a large amount of work, of which it seems ~25% is responding to webhook callbacks.
These are the exceptions though, and webhook callbacks are typically quite inactive. When averaged over the entire day, only 2.9% of API traffic was webhook driven.
So what?
This might seem disappointing, right? We did all this just to find out that webhook requests make up only 3% of total API traffic, not half as juicy as we suspected they might.
But actually, this is great.
Having done all the work to export our data into interconnected BigQuery datasets, we were able to take a really abstract product question and generate the data we needed to make decisions with confidence. All this without adding any specialised instrumentation, relying solely on the data we already collect.
From start to finish, this analysis took about 2hrs to put together. It helped us prioritise 2-4 weeks of a teams engineering time, which is a pretty insane return on investment.
Hopefully you find this as cool as I do.
Discuss this post on Hackernews. If you liked this post and want to see more, follow me on LinkedIn.